About
What is Parasol?
Parasol is a JavaScript library for a JavaScript library for developing parallel coordinates visualizations to enhance environmental decision making.
Features
Interactive linked plots, a data grid, and an array of clutter reduction techniques allowing for efficient visualization of trade-offs in high-dimensional data. Parasol provides developers with a toolbox for creating their own custom, interactive parallel coordinates visualizations.
Multi-objective optimization
Water treatment operations
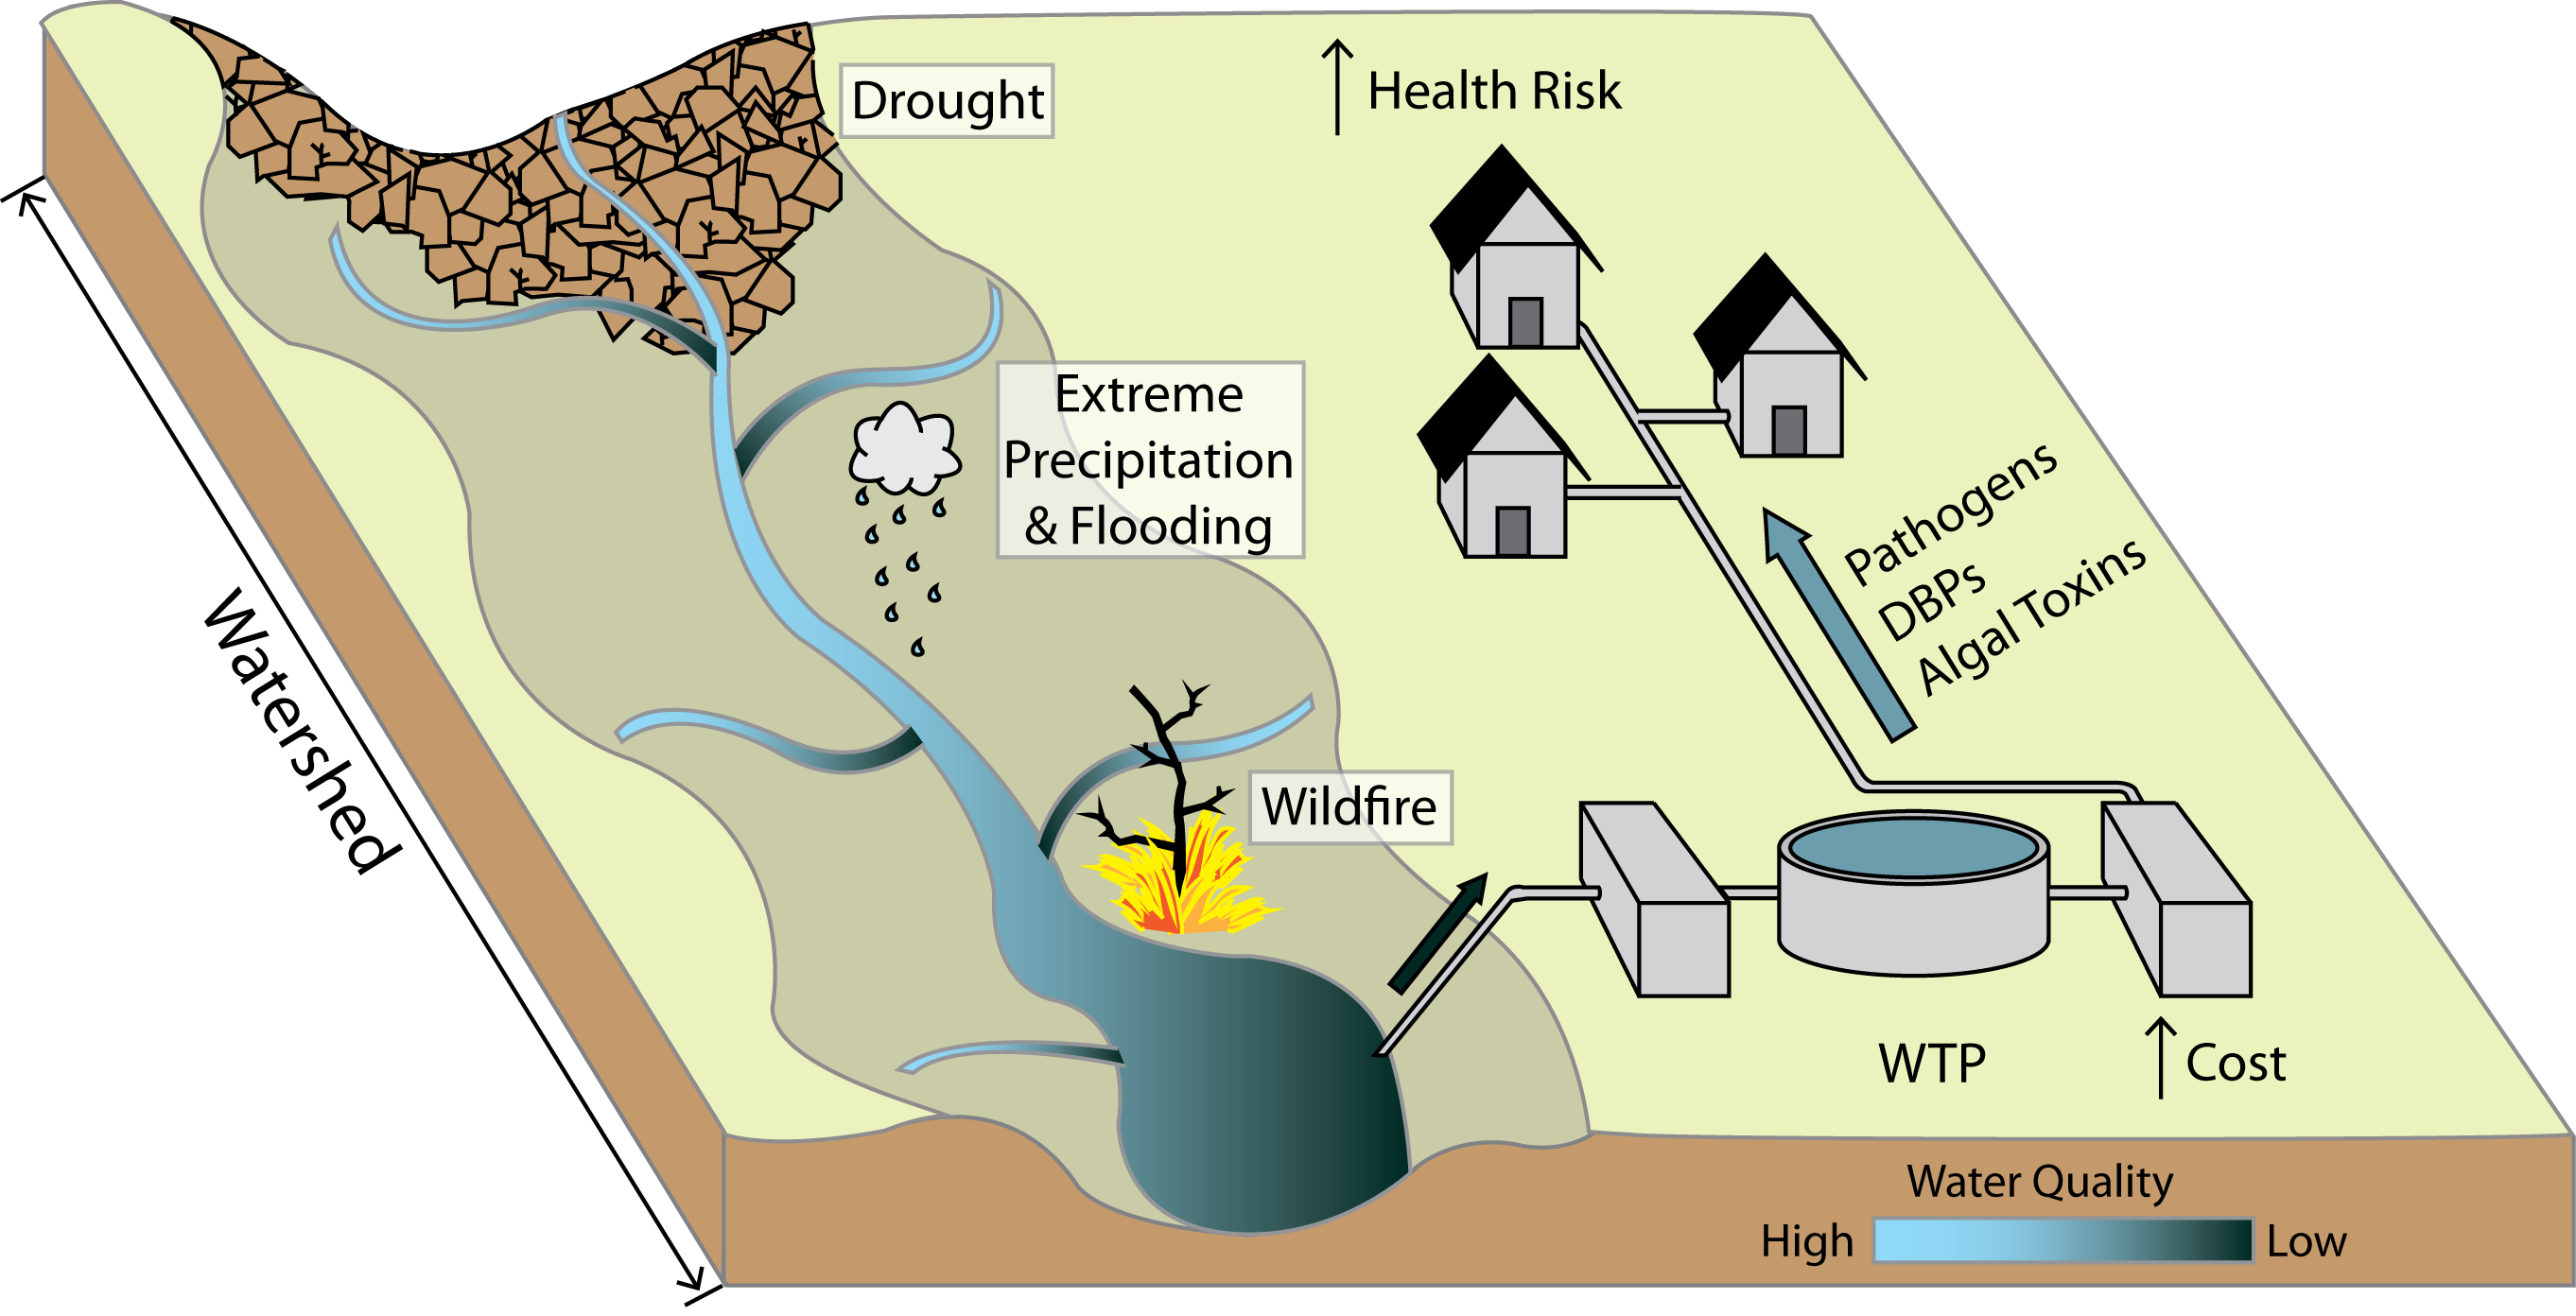
Optimization of water treatment operations for a utility facing variable source water quality. This research was done in partnership with the USEPA and Water Research Foundation on WRF Project 4636 : “An Integrated Modeling & Design Framework to Evaluate Adaption Strategies for Sustainable Drinking Water Utility Management Under Drought and Climate Change”.

Water resources management
Optimization of the water portfolio of the Lower Rio Grande Valley (LRGV) as formulated in Clarkin et al. (2018): https://doi.org/10.1061/(ASCE)WR.1943-5452.0000940
In the LRGV case study, a hypothetical municipality attempts to manage their water supply efficiently in the face of uncertain supply and demand due to population growth, agricultural demand, and transboundary water issues between the United States and Mexico. This municipality has three instruments with which it develops its water supply planning portfolio: permanent rights, spot market leases, and adaptive options contracts.
Additional examples
Linking plots and filtering data
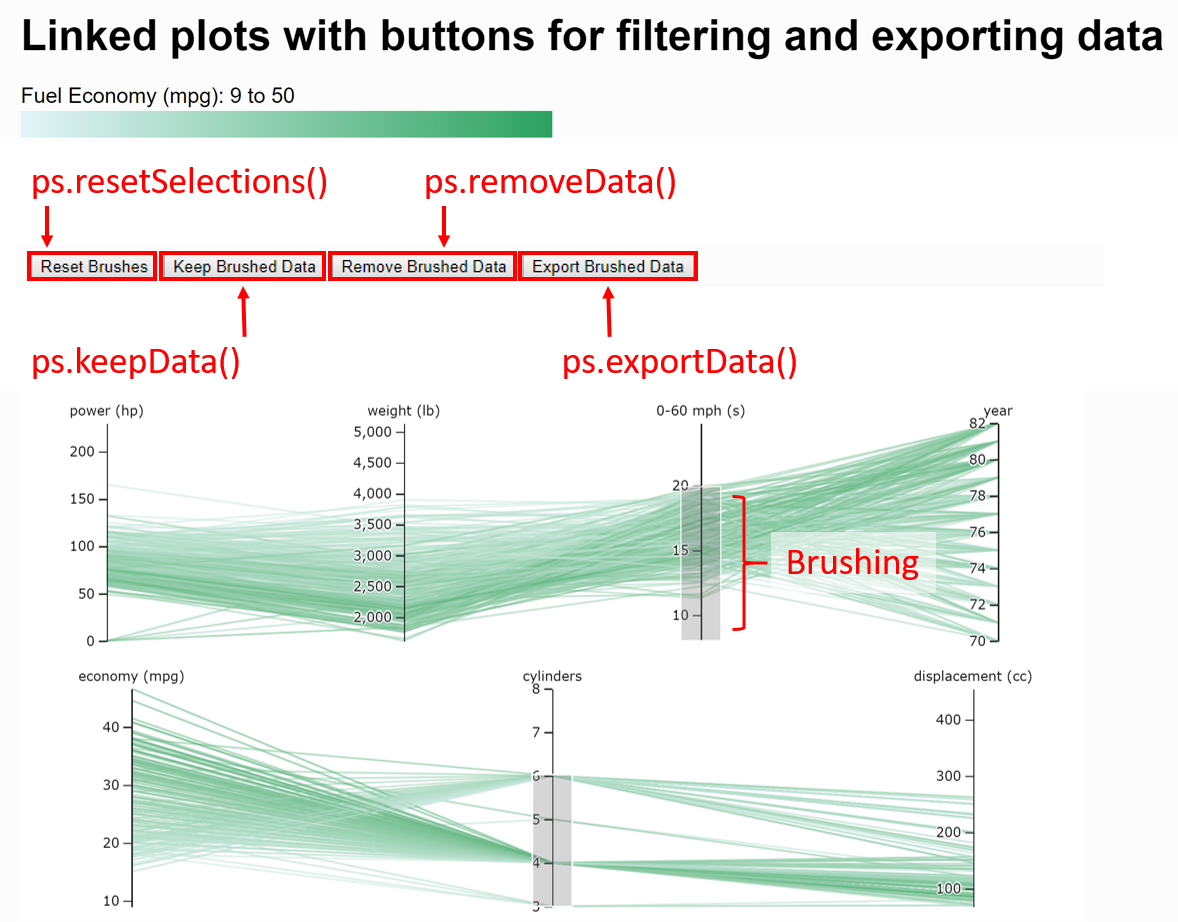
Parasol-based web application that demonstrates brushing across linked parallel coordinates plots and how buttons can be used to modify a Parasol object, ps, using the Parasol API. Parasol API: 1) ps.resetSelections() clears any brushes on either plot; 2) ps.keepData() keeps any data within the brush extents from ps and removes the rest; 3) ps.removeData() removes only the data within the brush extents; and 4) ps.exportData() exports only the data within the brush extents.
Curve bundling and linked grid
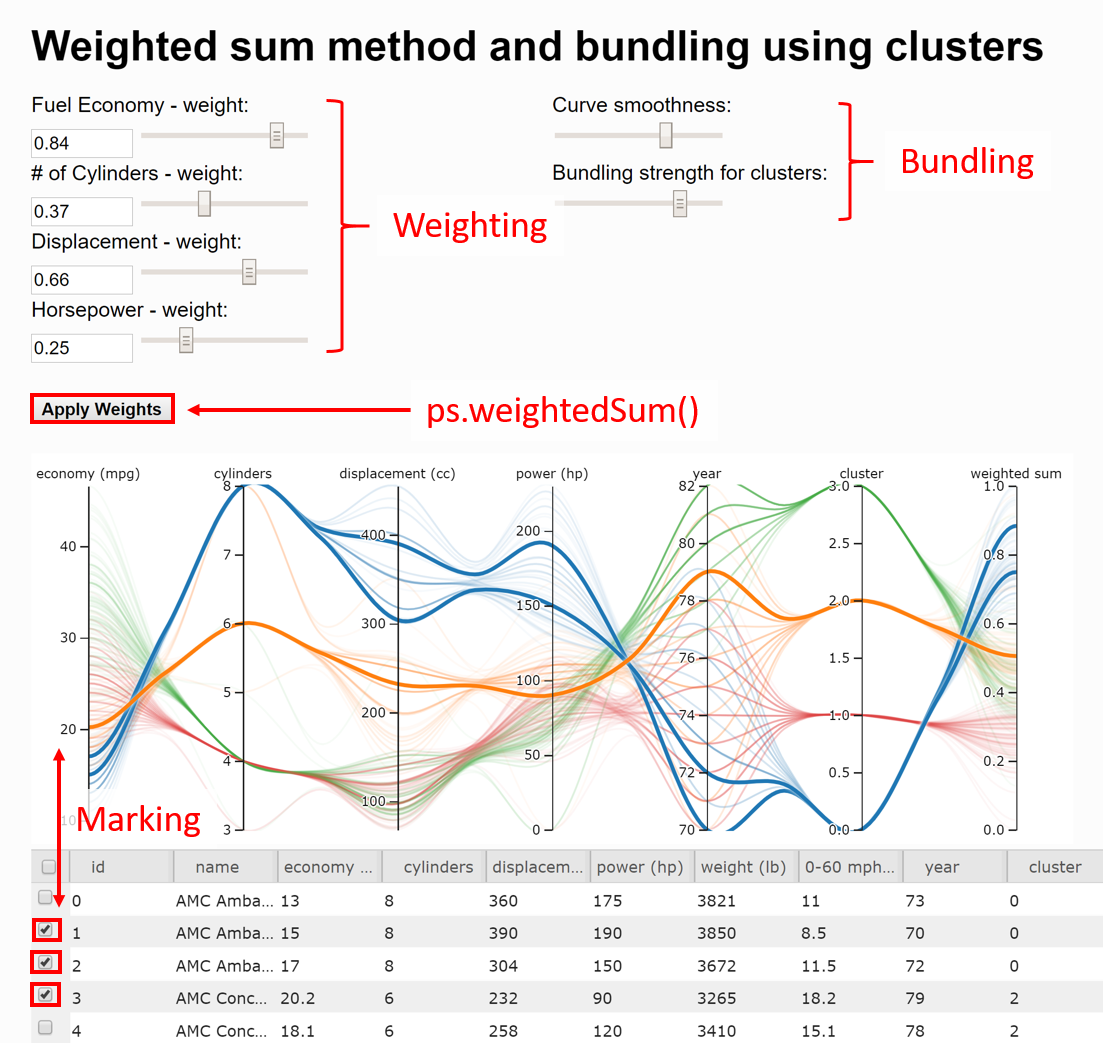
Parasol-based web application that allows users to specify weights to different metrics to calculate an aggregate score for each data point (i.e., car). This is achieved using the ps.weightedSum() function of the Parasol API. This example also shows how linking a data table with the plot allows users to mark solutions of interest and how curve bundling can be used to reduce visual clutter.